
Can You Trust a Lactate Threshold Result That Ignores Body Composition?
Lactate is measured in mmol per litre — but litres of what?
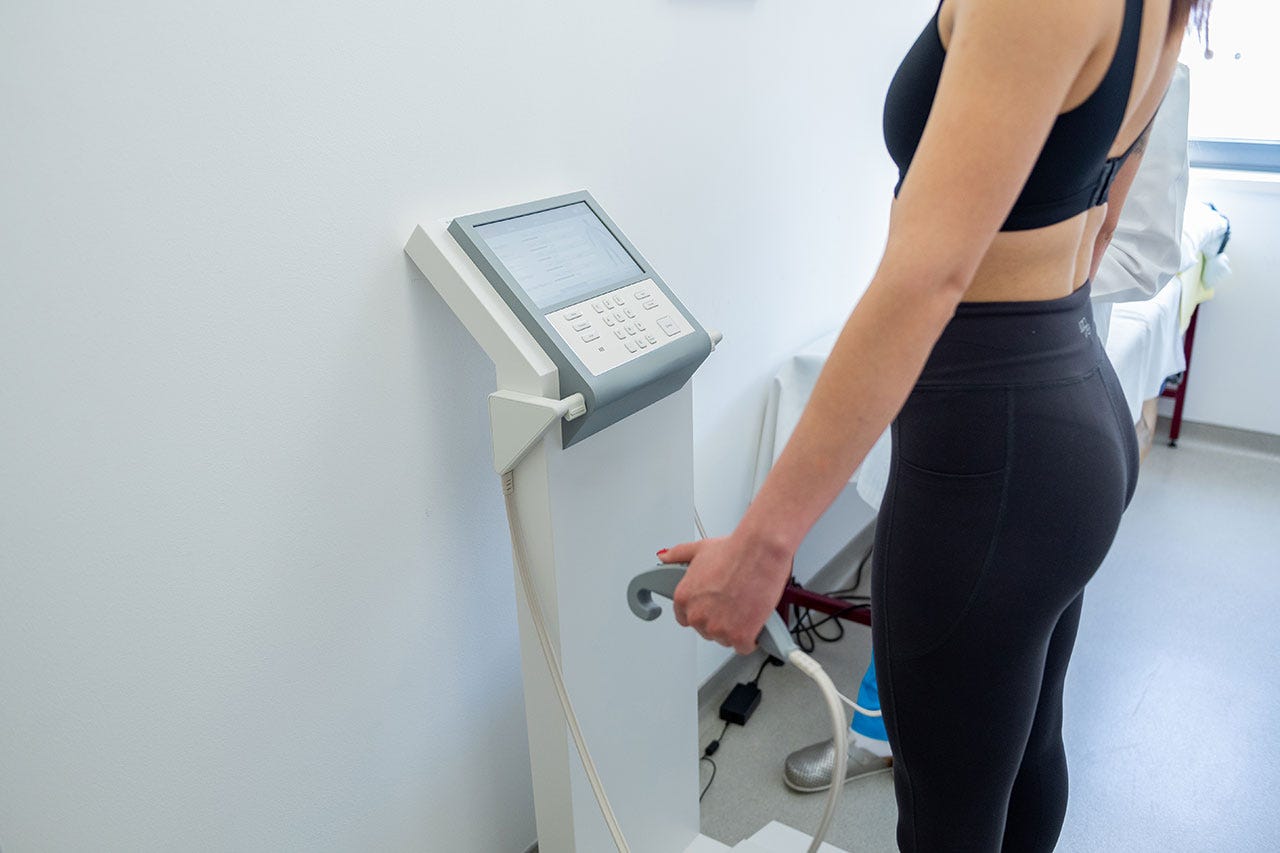
At the start of your lactate threshold test, my company does something that many fellow providers do not – measure your body composition.
This article covers our rationale.
For context, there are other articles in this series where I explain my decision to offer an advanced lactate threshold test in Singapore’s market; you can find them here.
With that said, let’s dive in.
Quick Walkthrough: How Lactate Threshold Tests Are Done
The first thing to know is that lactate threshold analysis is typically done using mathematical modelling.
Various science-based models exist.
For example, the framework underlying most contemporary lactate analyses was developed by Alois Mader and the Cologne sports medicine group (Mader & Heck, 1986; Mader, 2003; Wackerhage et al., 2022).
A common thread among these models is that they use multiple lactate measurements recorded at various intensities to derive physiological metrics.
The lactate measurements recorded at each stage, in units of mmol per litre, are as reflected on the lactate analysers.
With this understanding, let’s dive deeper into what this ‘litre’ refers to and how your lactate distribution space affects the reading.
Lactate Distribution Space: Why Your Body Composition Affects Your Threshold Results
When your blood sample is taken at the earlobe or fingertip, readings show up because lactate is produced inside contracting muscle.
Between its production and the time it’s measured, lactate distributes through the body’s water and lean-tissue compartments — and, importantly, not into fat, which is essentially metabolically inert in this exchange.
This process underpins the importance of understanding your body composition.
I.e., to convert a measured rise in blood lactate into a true rate of production, a model ideally identifies a volume into which the lactate spreads.
(Skip to the section below for an example if you need help with grasping the concept.)
Mader’s model, which we mentioned previously, addresses this by treating a fraction of total body water as the dilution space for blood lactate outside muscle cells (Mader & Heck, 1986).
Likewise for the method my company uses.
As for the test providers that do not take your body composition as part of the test process?
It is because not all methods take body composition into consideration.
Commonly practised threshold-detection methods — the modified D-max, or reading the workload off at a fixed 2 mmol/L or 4 mmol/L — simply apply a mathematical rule to the blood-lactate-versus-intensity curve to locate a threshold intensity, and they need only the lactate values and their matching workloads; there is no model of the underlying physiology for body composition to feed into.
As a result, such models can miss out on physiological nuances unique to individuals.
A logical follow-up question is then – does it really matter?
To me, it does, and you might concur;
Researchers in 2024 found that lactate dilution space scales with lean mass rather than total mass. As muscle mass rises, both the capacity for total lactate production and the lactate-distribution space — approximated as a fraction of body water — increase in proportion to fat-free mass (Meixner et al., 2024).
In other words, the same blood lactate reading means different things in a lean, muscular athlete and in a lighter or fatter one because the volume into which lactate was diluted differs.
The same applies if someone has gotten leaner or fatter.
More evidence in later paragraphs.
And the following section from INSCYD makes the concept easier to understand.
Example Case Scenario: Cyclist
Imagine a small-sized athlete riding a stationary bike at 200 watts. The leg muscles produce lactate, and the measured lactate concentration is 4 mmol/l.
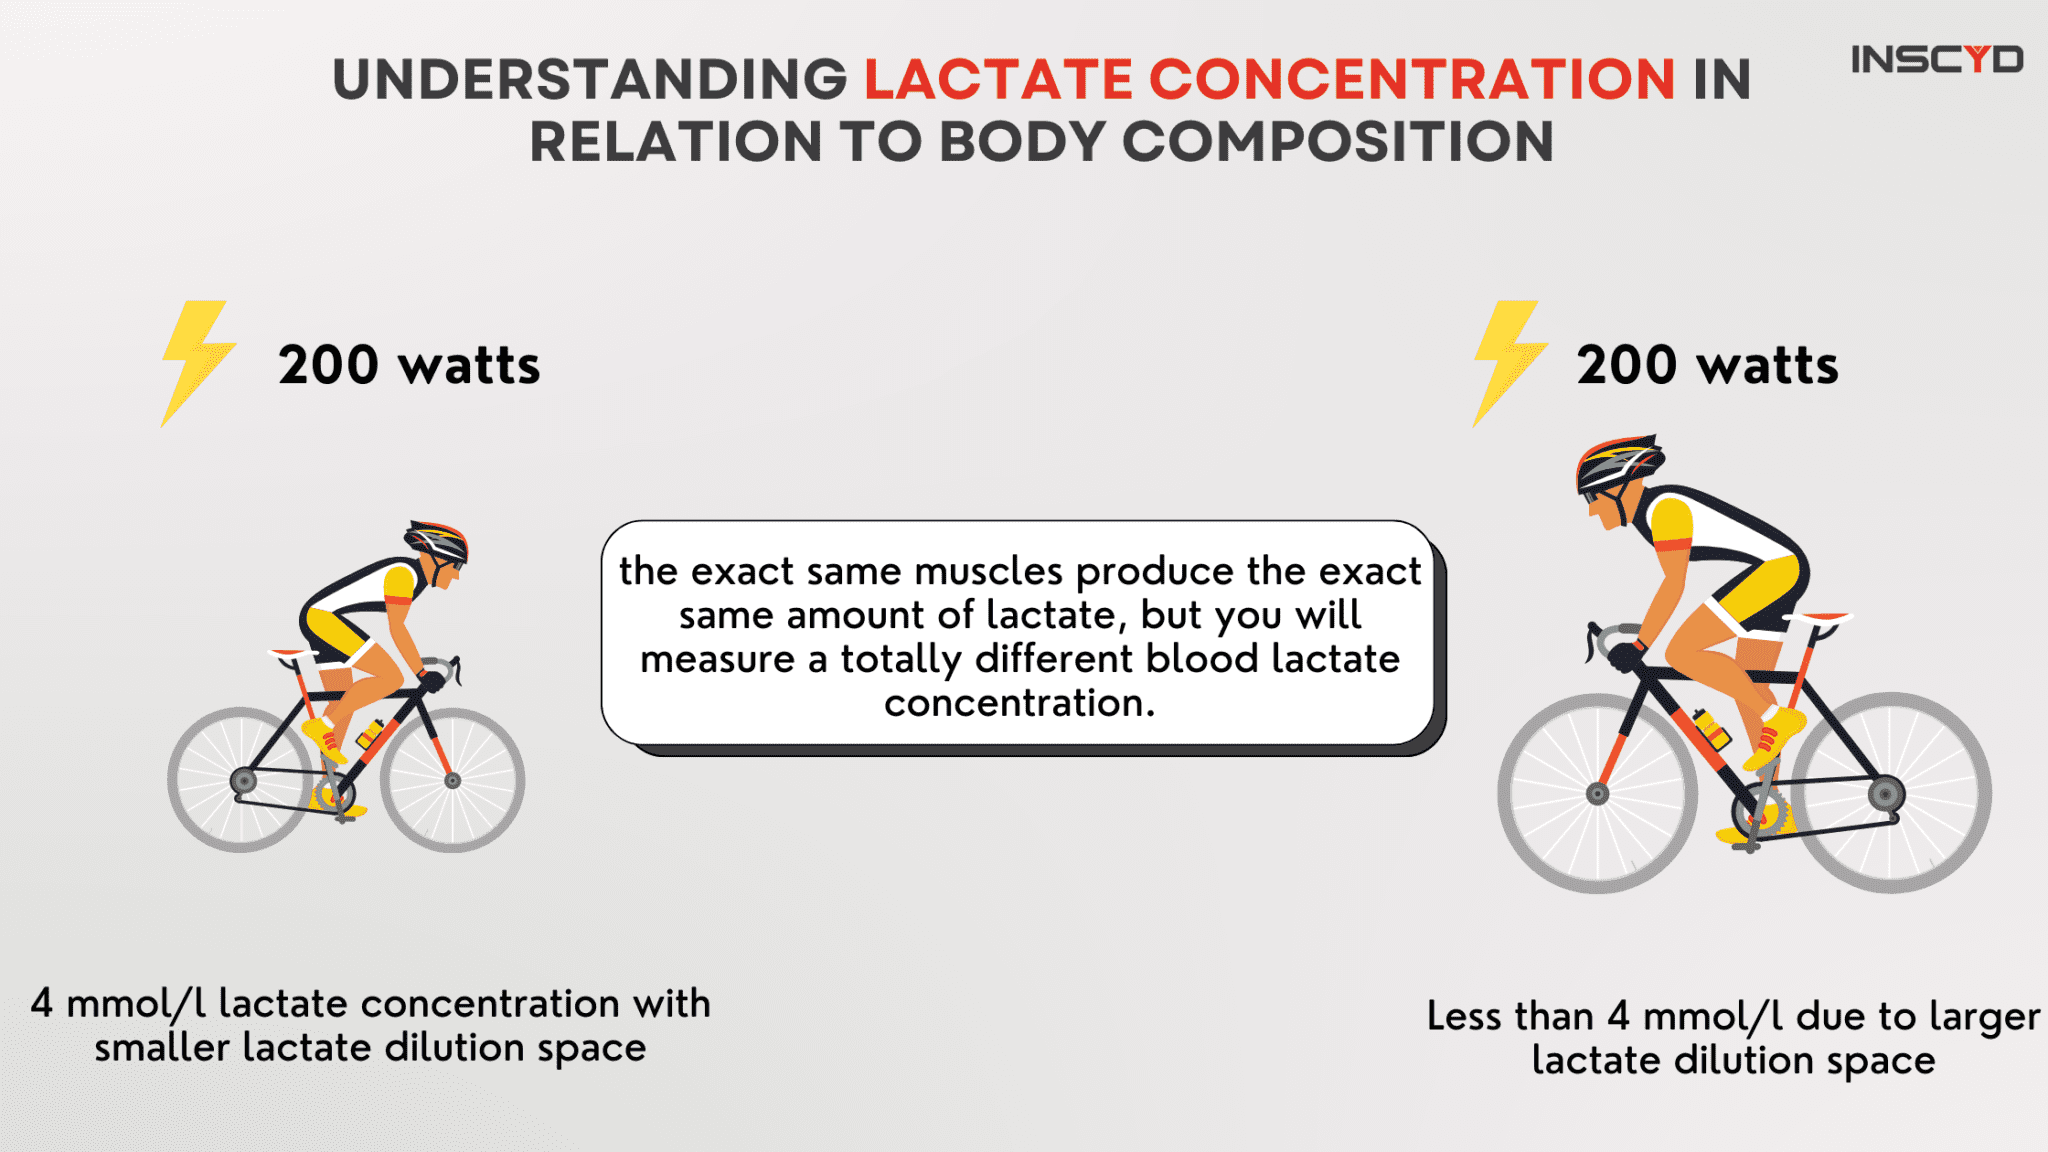
Now imagine we could put the exact same leg muscles into another – in this case, a larger athlete. We then ask the athlete to ride at the exact same intensity. Results? You’ll see a blood lactate concentration below 4 mmol/l. Simply because the athlete is larger, the lactate will be diluted in a larger volume.
In other words: the exact same muscles produce the exact same amount of lactate, but you will measure a (totally) different blood lactate concentration.
It is therefore possible that your lactate threshold shifts just by changing your body composition.
Consequently, if you’re working with lactate measurements and want to compare results over time (within an individual) or between individuals, it’s essential to understand body composition and the lactate dilution space, especially if the goal is to provide better training recommendations and to understand training effects.
What Research Says About Body Composition and Lactate Threshold
Scientific evidence aligns with the aforementioned.
For example, researchers had 50 cyclists perform a 15-second all-out sprint — the standard study used to quantify the maximal glycolytic rate — and paired it with bioelectrical impedance body composition measurements.
Fat-free mass alone explained about 79% of the variance in sprint work between individuals. The product of fat-free mass and the lactate rise explained about 82%.
Combining both predictors accounted for roughly 93% of the variance (Meixner et al., 2024).
Notably, differences in sprint work between men and women disappeared once total lactate production was expressed relative to fat-free mass.
These findings are bolstered by additional peer-reviewed evidence.
A study in 21 male runners by Buresh et al. (2004) found that body mass explained 58% of variability in velocity at lactate threshold, with significant negative relationships also found for fat mass and body fat percentage.
This directly links compositional variables to the lactate threshold velocity, independently of aerobic capacity.
Lastly, a 2025 study by Kettunen et al. in 52 elite endurance athletes confirmed that decreases in fat mass were significantly correlated with improved peak running speed and relative VO2max, while increases in lean mass were positively associated with performance gains in female athletes.
Conclusion
Ultimately, I chose to offer a differentiated service because I believe body composition is ideally addressed during lactate threshold analysis, as it can make a distinct difference in tracking your progress and in formulating training recommendations.
If you have any questions, please get in touch.
For more of such content, consider subscribing to the newsletter.
Till next time, take care!
References
Buresh, R. J., Berg, K. E., & Noble, J. M. (2004). Relationship between measures of body size and composition and velocity of lactate threshold. Journal of Strength and Conditioning Research, 18(3), 504–507. https://doi.org/10.1519/13273.1
INSCYD. (2025). Body composition in performance testing: Stop ignoring it. https://inscyd.com/whitepaper/body-composition-in-performance-testing/
Kettunen, O., Mikkola, J., & Ihalainen, J. K. (2025). Associations between body composition and performance in elite endurance athletes. International Journal of Sports Physiology and Performance, 20(11), 1530–1537. https://doi.org/10.1123/ijspp.2024-0506
Mader, A. (2003). Glycolysis and oxidative phosphorylation as a function of cytosolic phosphorylation state and power output of the muscle cell. European Journal of Applied Physiology, 88(4–5), 317–338. https://doi.org/10.1007/s00421-002-0676-3
Mader, A., & Heck, H. (1986). A theory of the metabolic origin of “anaerobic threshold.” International Journal of Sports Medicine, 7(S1), S45–S65. https://doi.org/10.1055/s-2008-1025802
Meixner, B. J., Nusser, V., Koehler, K., Sablain, M., Boone, J., & Sperlich, B. (2024). Relationship of peak capillary blood lactate accumulation and body composition in determining the mechanical energy equivalent of lactate during sprint cycling. European Journal of Applied Physiology, 124(11), 3399–3407. https://doi.org/10.1007/s00421-024-05529-9
Wackerhage, H., Gehlert, S., Schulz, H., Weber, S., Ring-Dimitriou, S., & Heine, O. (2022). Lactate thresholds and the simulation of human energy metabolism: Contributions by the Cologne sports medicine group in the 1970s and 1980s. Frontiers in Physiology, 13, Article 899670. https://doi.org/10.3389/fphys.2022.899670